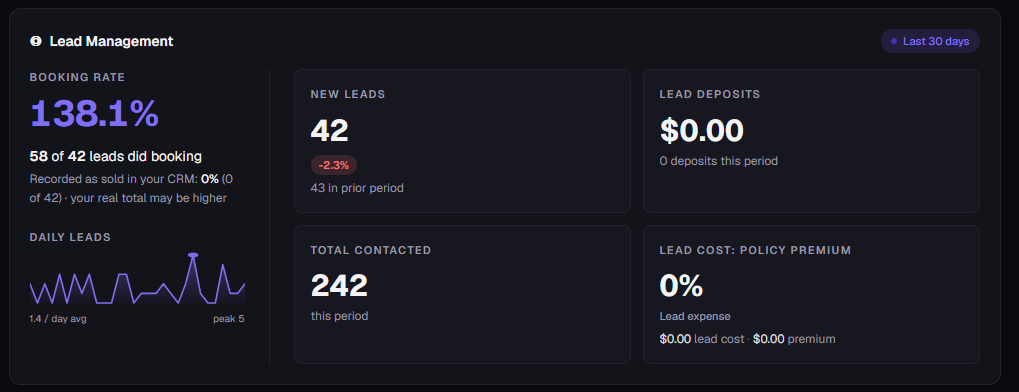
This measures the number of booking events compared with the number of new leads received during the period.
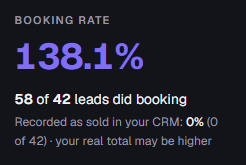
Example:
58 bookings
42 new leads
138.1% booking rate
There were 58 booking events generated from 42 leads. Because there are more bookings than leads, the percentage exceeds 100%. This likely means that some leads booked more than once or that the system counts multiple booking events associated with the same lead.
Important: 138.1% should not be interpreted as 138.1% of individual leads booking. It reflects the way booking events are being counted.
Recorded as Sold in CRM: 0%
0 of 42 leads are currently recorded as sold in the CRM.
This means the dashboard has no tracked sales attributed to these leads.
The note "your real total may be higher" indicates that some sales may exist but have not been recorded or properly attributed in the CRM.
This shows the average number of new leads received per day and the highest number of leads received on a single day.
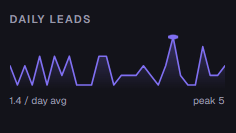
Example:
Average: 1.4 leads/day
Peak: 5 leads/day
Lead flow averaged about 1–2 new leads per day, with the busiest day generating 5 leads. This gives an idea of the consistency and volume of incoming leads during the period.
This is the total number of new leads generated during the selected reporting period.
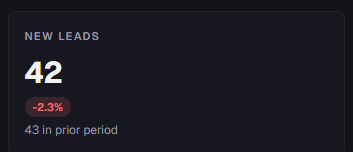
Example:
Current period: 42 leads
Previous period: 43 leads
Change: -2.3%
The business generated 42 new leads, compared with 43 in the previous period. This is only a 1-lead decrease, so lead generation remained relatively stable.
The -2.3% indicates that lead volume decreased slightly compared with the previous reporting period.
This represents the amount of money deposited or paid by leads during the reporting period.
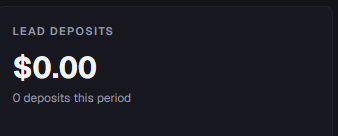
Example:
$0.00 in deposits
0 deposits recorded
The system currently shows no deposits attributed to these leads during the period.
This measures the total number of contact activities recorded during the period.
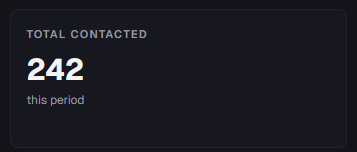
Example:
242 contacts
There were 242 recorded contact activities with leads. These could include calls, texts, or other communication activities depending on what the dashboard considers a "contact."
It's important to distinguish this from the number of leads:
42 new leads
242 contact activities
This means leads may have been contacted multiple times throughout the period.
This metric appears to measure lead acquisition cost in relation to the policy premium/revenue generated from those leads.
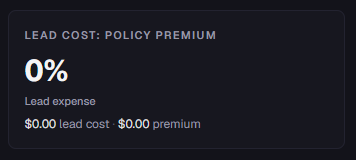
Example:
0%
Interpretation:
The dashboard currently has no policy premium/revenue recorded against these leads, so there is no measurable lead-cost-to-premium percentage for the period.
This does not necessarily mean the business generated no premium—it may mean the premium information has not been entered, synced, or attributed to the leads.