This indicates that all the statistics shown on the dashboard are based on SMS activity from the most recent 30-day period.
This represents the percentage of SMS messages that were successfully delivered to their recipients.
In this example:
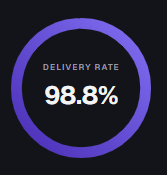
The delivery rate helps determine whether SMS campaigns are successfully reaching contacts. A lower rate could indicate issues such as invalid numbers, carrier restrictions, blocked messages, or other delivery failures.
95.5%
2,484 delivered
2,514 sent
Delivery rate = 2,484 ÷ 2,514 × 100 ≈ 98.8%
That means approximately 98.8 out of every 100 messages successfully reached the recipient.
This represents the total SMS activity recorded from both LeadConnector and Twilio during the selected period.
This number can include SMS activity across the connected messaging systems, so it does not necessarily equal the "sent" figure used in the delivery-rate calculation. Purpose: It gives an overall picture of how much SMS activity occurred in the account.
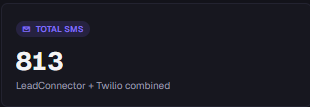
The first statistics box shows:
TOTAL SMS: 3,075
LeadConnector + Twilio combined
The Delivered section provides the actual delivery numbers:
661/ 683 sent

The dashboard converts this into the 98.8% delivery rate shown on the left.
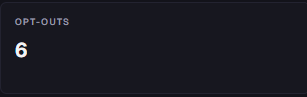
This represents contacts who opted out of receiving SMS messages during the selected period.
An opt-out typically occurs when a recipient uses an unsubscribe command such as STOP, depending on the messaging system and carrier rules.
Why this matters:
Opt-outs are important to monitor because they indicate recipients who no longer want to receive SMS messages. These contacts should generally be excluded from future SMS communication to avoid sending messages to people who have opted out.
Example:
If someone receives an SMS and replies:
STOP
They may be added to the messaging provider's opt-out/suppression list.
This metric provides an indication of how many recipients are engaging with the SMS messages, rather than simply receiving them.
It's particularly useful for evaluating conversations generated from SMS outreach.
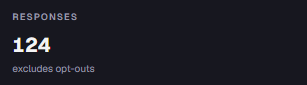
The Responses section shows:
RESPONSES: 124
excludes opt-outs
This means the system recorded 124 responses from recipients, while opt-out messages are excluded from this number.
For example, if a lead receives:
"Hi John, are you available for a quick call tomorrow?"
and replies:
"Yes, call me tomorrow."
That would generally count as a response.
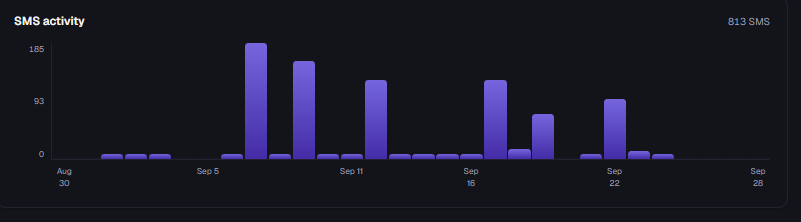
The large graph at the bottom is labeled:
SMS activity
It shows the volume of SMS activity over time.
The vertical axis represents the number of SMS messages, with markers around
The horizontal axis represents the dates.
How to read the bars
Each purple bar represents SMS activity for a particular day.
For example:
Tall bar: High SMS activity that day
Short bar: Lower SMS activity
No/very small bar: Little or no SMS activity